Managing Fermentation Performance
One of the goals of Escarpment Labs is to help provide our customers with the tools to make the best quality product. Often times, this means equipping our customers with the means to troubleshoot, or to work at preventing the possibility of a problem entirely.
In October, we announced our brand new partnership with Grist Analytics to provide brewers with top data management for their brewhouses and cellars. With this new blog series, Grist Analytics founder Brynn Keenan will be breaking down some of the most common questions, or troubleshooting methods for brewers powered by the data gathered through the Grist programming - including how to manage fermentation KPIs below!
If you want to learn more about our partnership with Grist Analytics, click here.
- - - - - - - - - - - - -
Fermentation consistency is required for quality, stability, and scheduling, but it can feel impossible to control. For example, the average brewery can predict fermentation length within 70hrs hours, while the most consistent brewery in Grist controls fermentation within 15 hours. Imagine the downstream consistency in dry hopping, centrifuging, and packaging schedules with that level of control. Not only does consistency enhance beer quality, but it gives cellar staff an unprecedented ability to plan. We’ll discuss how to measure yeast health analytically and approach process improvement methodically.
It’s difficult to fix a fermentation issue when you don’t know when and why it exists. Tracking fermentation Key Performance Indicators (KPIs) will let you know when you’re having issues, and get you started on figuring out why. This post will focus on fermentation KPIs that any brewery can access regardless of resources. These can be modified to suit your needs, though Grist recommends starting with Final Gravity, Attenuation, Hours to Final Gravity, and 48hr Gravity Drop. They’re easy to track, don’t require additional equipment, and are comparable between breweries and batches.
Attenuation & Final Gravity
These two KPIs should be tracked separately and evaluated together. They impact flavor, mouthfeel, alcohol, and stability. Attenuation can also indicate issues with brewhouse efficiency, yeast health, or contamination.
-
Final Gravity = the gravity at which beer has stabilized. In craft breweries, this is often determined by 2 or 3 days at the same gravity reading.
-
Attenuation = 100 % * (Original Gravity - Final Gravity) / (Original Gravity)
Trends to watch out for:
-
Any inconsistency that will impact flavor and beer quality
-
An upward trend may indicate under-attenuation and yeast issues
-
A downward trend may indicate contamination or hop creep issues

-
Any inconsistency will impact flavor, beer quality, and ABV requirements
-
Upward/downward trends
-
Inconsistencies with your yeast supplier’s recomendations
In the graphs above, final gravity is going down while attenuation is going up. In addition, attenuation is getting into a higher range than recommended by the yeast provider. These graphs together tell us that alcohol will be out of spec, flavor/mouthfeel are going to be off, and there may be hop creep or contamination causing superattenuation. The next steps would be:
-
Send beer samples for micro testing to a 3rd party lab (LCSM and qPCR for diastaticus and bacteria spoilers)
-
Check brewhouse Mash pH and Mash Temperature control charts
-
Validate the pH probe and thermometer if nothing looks off
-
Email you’re yeast provider all of the above data if you’re still struggling
-
Adjust raw materials or brewhouse metrics to hit the current ABV goal, or adjust the ABV goal if happy with flavor
48hr Drop and Time to Final Gravity
These two KPIs should be tracked separately and evaluated together. They are great indicators of yeast health, beer consistency, and cellar efficiency. Grist will accurately calculate these values for you regardless of sampling time. If not a Grist user, try using the calculated maximum fermentation rate or taking a daily measurement at exactly 48hrs.
-
48 Hr Drop = Original Gravity - Gravity at 48 fermentation hrs
-
Time to FG = Time to the first occurrence of final gravity
Trends to watch out for

-
Upward trends are typically good and indicate rapid fermentations. Watch out for any flavor differences that may appear.
-
Downward trends are typically concer and indicate yeast health issues, hop creep, or contamination. Watch out for yeast health off flavors (green apple, diacetyl, sulfur, meatiness)

-
48hr drop is a good diagnostic tool for long fermentations and yeast health
-
If low, this may indicate poor slurry health, low oxygen, or a lack of yeast nutrients
-
If high, this may indicate good yeast health and appropriate nutrients
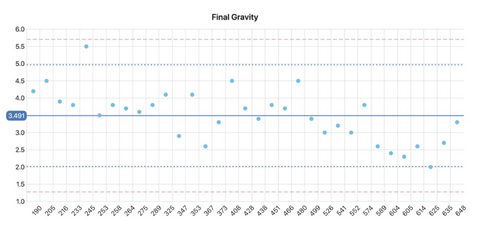
In the example above, Hours to Final Gravity are very long (>500hrs) until halfway through the chart, and then become inconsistent. 48hr Gravity Drop is very low (<5P) until halfway through the chart, then improves dramatically but becomes less consistent. The first half of both charts indicated very long fermentations, at least partly due to poor yeast health at the onset of fermentation. The second half of the chart shows inconsistent yeast health improvements, which lead to inconsistent improvements in fermentation time.

For the most part, when the 48hr drop is high, fermentation times go down. This relationship would break down due to long trickling fermentations (like the graph above). Reasons for this could include a lack of nutrients, contamination, hop creep, temperature, or issues with premature flocculation.
Yeast Generation
Yeast generation is another cheap and easy variable to track that can quickly illuminate issues with yeast management, contamination, and flavor defects.
-
Yeast Generation = The number of times a yeast slurry has been used (+1 for every fermentation)
Trends to watch out for

In Grist, we rarely see a negative correlation between yeast generation and fermentation performance (up to 10 generations). Talk to your yeast provider about proper yeast harvesting and storage if you do. Monitoring yeast generation will help track patterns in fermentation inconsistency that help make purchasing and scheduling decisions.
Monitoring KPIs is the cheapest form of quality control you can invest in. These metrics will help evaluate performance, quality, and diagnose fermentation issues effectively before they become widespread. If you’d like to know more about KPIs in other areas, check out our blog post on data analysis or webinar on production KPIs.
- - - - - - - - - - - - -
Originally published at gristanalytics.com
ABOUT THE AUTHOR:
Brynn is a biochemist by training and a fermentation scientist by trade. Her experience in brewing QC includes building micro, sensory, and analytical programs for Left Hand Brewing and Inland Island Yeast Laboratories. Brynn started Grist Analytics to bring big brewery QC tools to craft by making data entry, visualization, and analysis easy. She now helps breweries across the world turn production data into actionable information. Brynn is passionate about good beer, rock climbing, and building community.